
Chart patterns play a crucial role in technical analysis, helping traders and investors anticipate future price movements based on past trends. In this article, we will explore 6 essential chart patterns that are pivotal for both novice and seasoned traders. These patterns are not merely random shapes on a chart; they reflect the underlying market psychology and can indicate continuity or reversal of trends.
Understanding chart patterns gives traders an edge in predicting potential market movements and making informed trading decisions. Each pattern not only provides insights into market sentiment but also helps in identifying profitable trading opportunities. By the end of this guide, you will have a fundamental understanding of how these patterns work and how to apply them effectively in your trading strategy.
Why Chart Patterns Matter in Trading?

Chart patterns are foundational to technical analysis, offering traders and investors a visual framework to understand market trends and price movements. These patterns are born out of the collective actions of market participants, reflecting both the psychological and fundamental dynamics at play. Recognizing these patterns helps traders predict future market behavior, enabling them to execute trades based on probable outcomes rather than mere speculation.
- Predictive Power: Chart patterns provide insights into potential price movements. For example, a ‘head and shoulders’ pattern might suggest a reversal from a bullish to a bearish trend. Traders who can identify these patterns early often gain a significant advantage in timing their entries and exits.
- Risk Management: Understanding chart patterns aids in setting stop-loss orders and target prices, crucial aspects of risk management. By recognizing where a pattern fails, traders can cut losses and let profits run effectively.
- Trading Efficiency: Chart patterns can streamline the trading process. Instead of getting overwhelmed by the vast amount of market data, traders can focus on specific patterns that align with their trading strategy, enhancing decision-making efficiency.
- Historical Relevance: Many chart patterns are respected because they have shown consistent results over time. This historical relevance provides traders with confidence, as these patterns have been tested across different market conditions.
Also read: 7 Best Predictions for the Stock Market in 2024
Understanding the importance of chart patterns is not just about recognizing shapes on a graph; it’s about interpreting what these shapes signify about market sentiment and trader behavior. By mastering this aspect of technical analysis, traders can enhance their ability to make informed decisions, leading to more successful trading outcomes.
6 Essential Chart Patterns to Know
In the dynamic world of trading, mastering chart patterns is akin to unlocking the secrets of market movements. These patterns, formed by the interplay of price action and time, serve as invaluable tools for traders seeking to decipher market trends and anticipate future price movements. Among the multitude of patterns that adorn trading charts, six emerge as essential knowledge for any aspiring or seasoned trader.
From the timeless symmetry of the double top to the compelling reversal signals of the bullish and bearish engulfing patterns, each chart pattern encapsulates distinct market dynamics and potential trading opportunities. By familiarizing oneself with these six essential chart patterns, traders can elevate their technical analysis skills and navigate the complexities of financial markets with confidence and precision.
1. Head and Shoulders: Identifying Reversals
The Head and Shoulders pattern is one of the most reliable and popular chart patterns used by traders to predict reversals. This pattern typically appears at the end of a bullish trend and is characterized by three peaks: the left shoulder, the head, and the right shoulder, with the head being the highest peak.
Formation of the Pattern
- Left Shoulder: Formed by a price rise followed by a price decline.
- Head: After the low of the left shoulder, the price ascends to a higher peak and then declines again.
- Right Shoulder: The price rises again but does not exceed the height of the head, forming the third and final peak before a final decline.
- Significance
This pattern is significant because it showcases a battle between buyers and sellers: buyers attempt to continue the bullish trend, failing progressively as sellers take over. The completion of the pattern occurs when the price falls below the neckline (the support level connecting the lows between the shoulders and head).
Trading Strategy
- Entry Point: Traders generally enter a short position when the price breaks below the neckline after forming the right shoulder.
- Stop Loss: It’s prudent to set a stop-loss order just above the right shoulder to minimize potential losses should the trend reversal fail to materialize.
- Profit Targets: The minimum expected downward move after the breakout can be estimated by measuring the vertical distance from the head’s peak to the neckline and extending it downward from the breakout point.
Understanding and applying the Head and Shoulders pattern can significantly enhance a trader’s ability to make calculated and confident trading decisions, especially when considering entry and exit points.
2. Double Top and Double Bottom: Classic Reversal Setups
Double Top and Double Bottom are widely recognized reversal patterns that signal potential shifts in market trends. These patterns are mirror images of each other and indicate critical points where the market fails to break through a support or resistance level on two separate occasions.
Double Top
- Formation: This pattern occurs at the peak of an upward trend when the price hits a high point, pulls back, and then returns to the same high point before reversing into a downward trend.
- Significance: A Double Top is a bearish reversal pattern that signals the end of an uptrend and a shift towards a downtrend. It is confirmed when the price falls below the support level formed by the valley between the two peaks.
- Trading Strategy: Traders might consider entering a short position once the price breaks below the support level, with a stop loss set just above the highest peak.
Double Bottom
- Formation: This pattern appears during a downtrend when the price reaches a low, rebounds, falls back to the same low level, and finally starts an upward trend.
- Significance: A Double Bottom is a bullish reversal pattern indicating the exhaustion of a downtrend and the beginning of an uptrend. It is confirmed when the price breaks above the resistance level formed by the peak between the two lows.
- Trading Strategy: Traders might enter a long position once the price breaks above the resistance level, setting a stop loss just below the lowest low.
Both patterns are pivotal for traders because they provide clear entry, stop loss, and profit target levels, making them excellent tools for planning trades and managing risks. These setups are not only straightforward but also help in capitalizing on market reversals effectively.
3. Triangles: Symmetrical, Ascending, and Descending
Triangle patterns are common in technical analysis, serving as continuation indicators that suggest the ongoing trend will resume after a period of consolidation. These patterns are categorized into three types based on their slope and what they signal about market sentiment.
Symmetrical Triangle
- Formation: This pattern is formed by two converging trendlines with similar slopes, one ascending and the other descending, that come to meet at a point. It appears during a period of consolidation when the forces of supply and demand are nearly equal.
- Significance: A symmetrical triangle suggests a period of indecision among traders but is generally followed by a continuation of the trend that was in place before the triangle formed.
- Trading Strategy: Traders often wait for a breakout from one of the trendlines before taking a position in the direction of the breakout. This breakout is considered significant and likely to result in a continuation of the prevailing trend.
Ascending Triangle
- Formation: Characterized by a horizontal upper trendline that acts as resistance and an ascending lower trendline that acts as support.
- Significance: This pattern is typically considered bullish and is often found during an uptrend, indicating that buyers are more aggressive than sellers as the price continues to make higher lows.
- Trading Strategy: A breakout above the resistance, with increased volume, can signal a buy entry point, with profit targets set by the height of the back of the triangle.
Descending Triangle
- Formation: Features a horizontal lower trendline as support and a descending upper trendline as resistance.
- Significance: This pattern is generally bearish and usually emerges during a downtrend, suggesting that sellers are more forceful than buyers, pushing the price to make lower highs.
- Trading Strategy: A breakout below the support level, especially on higher volume, suggests a sell position could be taken, with the depth of the triangle suggesting the potential decline’s magnitude.
Triangle patterns are valuable for traders because they provide clear visual cues about market sentiment and potential price movement. Whether bullish or bearish, these patterns help traders align their positions with the likely continuation of the prevailing trend.
4. Flags and Pennants: Short-Term Continuation Patterns
Flags and pennants are short-duration patterns that appear in markets experiencing strong, directional trends. They are typically seen as pauses or breathers in a rapid price move, after which the initial trend resumes.
Flags
- Formation: A flag pattern is characterized by a small rectangular shape that slopes against the prevailing trend, formed by parallel trendlines that can be either upward or downward sloping. It occurs after a sharp movement in price and looks like a small channel after a steep price line.
- Significance: Flags indicate consolidation after a strong price move and typically signal that the previous upward or downward trend is likely to continue.
- Trading Strategy: Traders look for a breakout from the flag formation in the direction of the prior trend as a signal to enter a trade. The target is often set by measuring the height of the prior move and projecting it from the point of breakout.
Pennants
- Formation: Similar to flags but instead of a rectangle, a pennant forms a small symmetrical triangle that starts wide and converges as the pattern develops. This is created by converging trendlines that connect the high and low prices of the consolidation period.
- Significance: Like flags, pennants are formed after a significant move in the stock and indicate that the market is consolidating briefly before continuing in the direction of the initial trend.
- Trading Strategy: The trading approach for pennants is similar to flags; a breakout from the pattern in continuation with the main trend suggests an entry point. The profit target is again determined by the height of the previous trend move projected from the breakout point.
Both flags and pennants are particularly valued for their reliability and the clear trading signals they offer. Their appearance during high volatility phases makes them integral tools for traders aiming to capitalize on continued momentum.
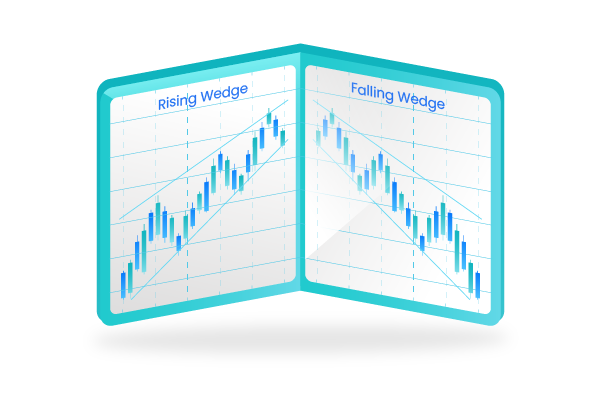
5. Wedges: Rising and Falling
Wedges are a type of chart pattern represented by converging trend lines over a period of 10 to 50 trading sessions. These patterns are similar to triangles but have a significant slope and are used to signal both continuation and reversal depending on their direction and the existing market trend.
Rising Wedge
- Formation: A rising wedge is formed when the price consolidates between upward sloping support and resistance lines. This pattern occurs in both uptrends and downtrends but is typically considered a bearish reversal pattern when it appears during an uptrend.
- Significance: It suggests that despite the rising prices, the uptrend is weakening as the highs are not increasing as much as the lows. This compression often leads to a breakdown as buying momentum wanes.
- Trading Strategy: Traders might consider taking a short position upon the confirmation of a price break below the wedge’s support line. The target price can be estimated by measuring the height of the back of the wedge and extending it downward from the breakout point.
Falling Wedge
- Formation: This pattern is characterized by downward sloping support and resistance lines and appears during both downtrends and uptrends. It is generally considered a bullish reversal pattern when formed during a downtrend.
- Significance: The falling wedge indicates that the selling pressure is starting to diminish and a reversal to the upside is imminent as the lows decrease at a slower rate than the highs.
- Trading Strategy: A long position may be considered after the price breaks above the resistance of the wedge. The target for this setup is typically the highest point of the wedge projected upwards from the breakout.
Wedges are crucial for providing signals about the continuation of trends or potential reversals and are highly valued for their dual interpretative nature. Whether indicating a slowdown in momentum or a potential explosive reversal, wedges help traders adjust their strategies to capitalize on market movements effectively.
Read More: Credit Trading: Navigating Fixed Income Markets
6. Cup and Handle: A Bullish Continuation Indicator
The Cup and Handle pattern is a bullish chart formation that resembles a tea cup on a chart. This pattern represents a pause in an upward trend followed by a continuation of the uptrend, making it a favorite among traders looking to capitalize on momentum.
Formation
- Cup: The cup is a ‘U’ shaped curve that appears as the price initially declines, then stabilizes and begins to rise back to the original start point of the decline. This part of the pattern can last between several months to a year.
- Handle: After the cup is formed, the price undergoes a smaller downward drift creating a slight dip or “handle,” which is generally a continuation of the initial trend but at a milder slope.
Significance
- The Cup and Handle pattern is significant because it shows a consolidation and a build-up of buying pressure during the handle formation. The completion of the handle with a breakout above its resistance serves as a confirmation of continued bullish momentum.
Trading Strategy
- Entry Point: A trade can be initiated once the price breaks above the resistance level at the top of the handle.
- Stop Loss: To manage risk, a stop loss can be placed just below the lowest point of the handle.
- Profit Targets: The target can be calculated by measuring the depth of the cup and projecting that same distance upward from the breakout point.
The Cup and Handle pattern is particularly powerful because it offers a clear and measurable target, and its formation over an extended period makes the breakout highly reliable and a strong signal for the continuation of the prior trend.
Conclusion
Chart patterns are invaluable tools in the arsenal of any trader or investor. They provide a visual representation of market sentiment, illustrating the ongoing battle between buyers and sellers. By learning to recognize and interpret these patterns, traders can significantly enhance their ability to make informed decisions, manage risk, and capitalize on market opportunities.
Each of the 12 chart patterns discussed in this article—ranging from the reversal signals of Head and Shoulders to the continuation cues of Flags and Pennants—serves a unique purpose in technical analysis. Whether you’re a novice trader or an experienced market analyst, mastering these patterns can provide you with deeper insights into market trends and price movements.
As you integrate these patterns into your trading strategy, remember that no pattern works all the time, and their effectiveness can be influenced by market conditions, volume, and other factors. Continual learning and adaptation to changing markets are essential for sustained success in trading.

Carina Caringal is an experienced writer and analyst in the Crypto and Blockchain world, with four years of expertise. She simplifies the complex world of Digital Currencies for her readers, offering clear insights and updates on the latest trends and technologies.